Trace and inspect an LLM call
What you'll do: inspect the trace the gateway recorded for you, read the observability dashboards, and report your own spans so a whole chain — not just the model call — shows up in one trace.
1. Find the trace
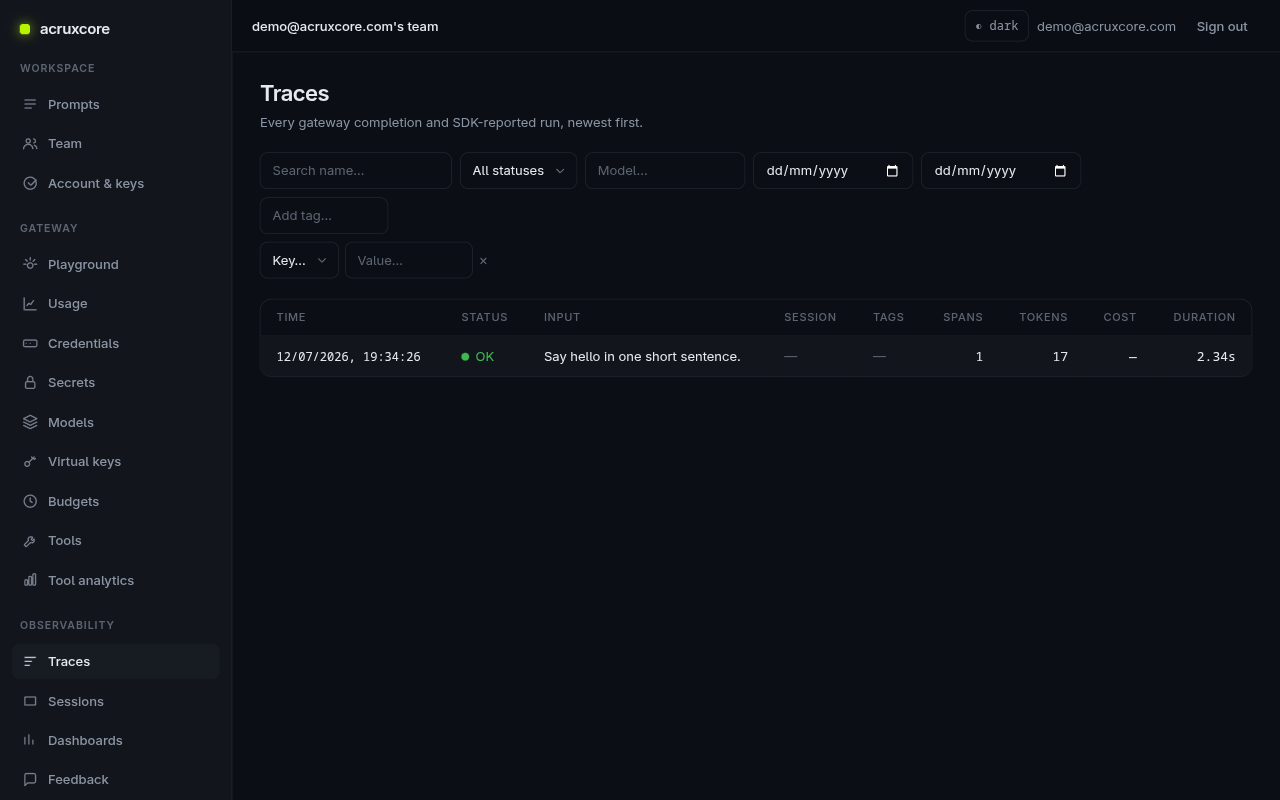
Every completion through the gateway is recorded automatically. Open Observability → Traces: the newest calls are on top, with status, input, span count, tokens, cost, and duration at a glance.
2. Read the spans
Click a trace to open it. A trace is a tree of spans — each a unit of work. Expand the LLM span to see the resolved model, provider, token usage, and latency, plus a link back to the gateway request that produced it.
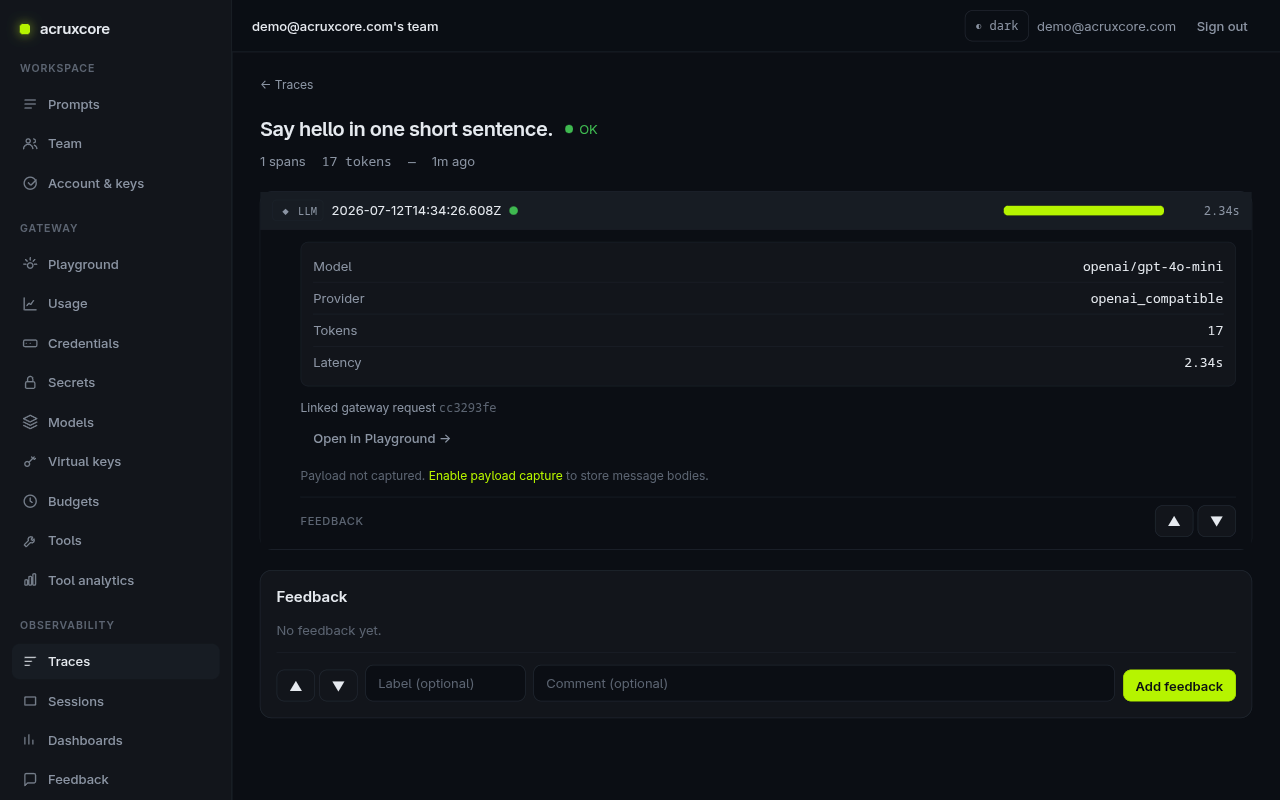
Message bodies aren't stored unless you enable payload capture (per team in
Observability → Settings, or per request with capturePayloads: true). Metadata
like model, tokens, and latency is always recorded.
3. See the big picture
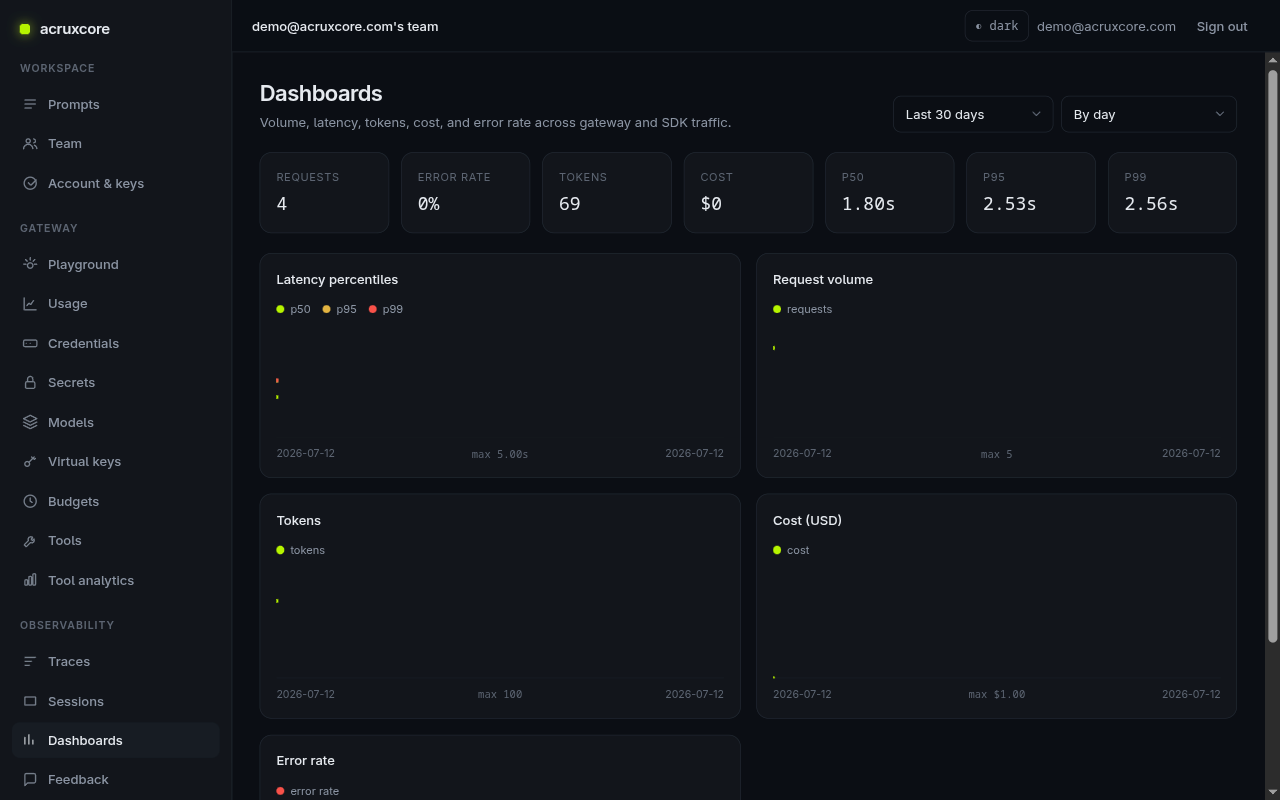
Observability → Dashboards aggregates traffic — volume, latency, token, and cost trends across all your calls — so you can spot a regression or a cost spike without reading traces one by one.
4. Report your own spans
Gateway calls trace themselves, but your app usually does more around them —
retrieval, post-processing, several model calls in a chain. Report those as spans
so the whole operation is one trace. Spans form a tree via spanId/parentSpanId;
omit traceId to mint a new trace.
- Node (SDK)
- curl
- Python (requests)
import AcruxCore from '@acruxcoreai/sdk';

const hub = new AcruxCore();

const { traceId } = await hub.trace({
  name: 'support-answer',
  tags: ['support'],
  spans: [
    {
      spanId: 'retrieve',
      name: 'search_docs',
      kind: 'retrieval',
      status: 'ok',
      startTime: '2026-07-12T10:00:00.000Z',
      endTime: '2026-07-12T10:00:00.220Z',
    },
    {
      spanId: 'answer',
      parentSpanId: 'retrieve',
      name: 'gpt-4o-mini',
      kind: 'llm',
      model: 'openai/gpt-4o-mini',
      provider: 'openai_compatible',
      usage: { promptTokens: 120, completionTokens: 40, totalTokens: 160 },
      startTime: '2026-07-12T10:00:00.230Z',
      endTime: '2026-07-12T10:00:01.400Z',
    },
  ],
});

console.log('reported trace', traceId);
curl -X POST "$ACRUXCORE_BASE_URL/traces" \
  -H "Authorization: Bearer $ACRUXCORE_API_KEY" \
  -H "Content-Type: application/json" \
  -d '{
    "traces": [{
      "name": "support-answer",
      "tags": ["support"],
      "spans": [
        {"spanId":"retrieve","name":"search_docs","kind":"retrieval","status":"ok","startTime":"2026-07-12T10:00:00.000Z","endTime":"2026-07-12T10:00:00.220Z"},
        {"spanId":"answer","parentSpanId":"retrieve","name":"gpt-4o-mini","kind":"llm","model":"openai/gpt-4o-mini","provider":"openai_compatible","usage":{"promptTokens":120,"completionTokens":40,"totalTokens":160},"startTime":"2026-07-12T10:00:00.230Z","endTime":"2026-07-12T10:00:01.400Z"}
      ]
    }]
  }'
import os, requests

base, key = os.environ["ACRUXCORE_BASE_URL"], os.environ["ACRUXCORE_API_KEY"]
requests.post(f"{base}/traces", headers={"Authorization": f"Bearer {key}"}, json={
    "traces": [{
        "name": "support-answer",
        "tags": ["support"],
        "spans": [
            {"spanId": "retrieve", "name": "search_docs", "kind": "retrieval", "status": "ok",
             "startTime": "2026-07-12T10:00:00.000Z", "endTime": "2026-07-12T10:00:00.220Z"},
            {"spanId": "answer", "parentSpanId": "retrieve", "name": "gpt-4o-mini", "kind": "llm",
             "model": "openai/gpt-4o-mini", "provider": "openai_compatible",
             "usage": {"promptTokens": 120, "completionTokens": 40, "totalTokens": 160},
             "startTime": "2026-07-12T10:00:00.230Z", "endTime": "2026-07-12T10:00:01.400Z"},
        ],
    }],
})
Reload Traces and your support-answer trace appears with both spans nested
under one tree.
What's next
- Collect thumbs-up/down on these traces and turn them into a dataset: evaluate a prompt.
- Full field reference: Traces in the API Reference.